XRP Price Flashes Bullish Pattern, Eyes 35% Rally Toward $2 Price Range
XRP is showing signs of a potential bullish reversal. The token has climbed to around $1.39, gaining 6.6% in the past 24 hours. But despite the latest bounce, XRP remains well below its previous highs.
Now, a technical pattern could give bulls another reason to pay attention.
Crypto analyst Ali Martinez has identified an inverse head-and-shoulders pattern on XRP’s daily chart. If the setup confirms and XRP breaks through its key resistance, the pattern suggests a potential 35% move toward $2.
The key level to watch is $1.55.
XRP Forms an Inverse Head-and-Shoulders Pattern
XRP’s daily chart is developing what traders typically consider a bullish reversal structure: an inverse head-and-shoulders pattern.
The pattern consists of three key parts:
- A left shoulder
- A lower head
- A right shoulder
XRP TARGETS $2
— Ali Charts (@alicharts) September 18, 2026
On the daily chart, $XRP appears to be forming the right shoulder of an inverse head-and-shoulders pattern.
If the setup continues to develop, I’m watching for a move toward the neckline near $1.55.
That’s the key level.
A confirmed breakout above $1.55 could… pic.twitter.com/HQfEkWiDoj
XRP has already formed the left shoulder and head, while the right shoulder appears to be developing near $1.33.
According to Martinez, $1.55 is the critical resistance level. This area represents the neckline of the pattern.
A decisive move above the neckline could confirm the setup. Based on the pattern’s projected move, XRP could then have room for a 35% rally toward $2.
But there is an important level on the downside.
XRP needs to hold around $1.20 to maintain the current bullish structure. A breakdown below this support could weaken the setup and potentially invalidate the inverse head-and-shoulders pattern.
In other words, traders have two levels to watch: $1.55 on the upside and $1.20 on the downside.
Golden Cross Adds Another Bullish Signal
The inverse head-and-shoulders isn’t the only technical development attracting attention.
XRP is also approaching a potential golden cross.
The token’s 50-day moving average is currently about 2% below its 200-day moving average, making the gap the narrowest since XRP’s previous golden cross in August 2024.
A golden cross occurs when the 50-day moving average moves above the 200-day moving average. Traders commonly interpret the crossover as a potential long-term bullish signal.
However, XRP’s historical performance shows why the indicator shouldn’t be viewed in isolation.
Of XRP’s 10 successful golden crosses, five were followed by significant gains within 90 days. The April 2017 crossover, for example, preceded a reported 1,009.6% rally, while the February 2021 crossover was followed by a 135% increase.
The longer-term picture is less consistent.
None of XRP’s previous 16 golden crosses remained intact for 12 months. Each was eventually followed by a death cross, when the 50-day moving average falls back below the 200-day average.
That makes the current setup interesting, but historical data alone doesn’t guarantee that the next crossover will produce the same outcome.
XRP Whale Inflows Reach a Six-Month High
Technical indicators aren’t the only factor traders are watching.
Whale activity on Binance has also increased.
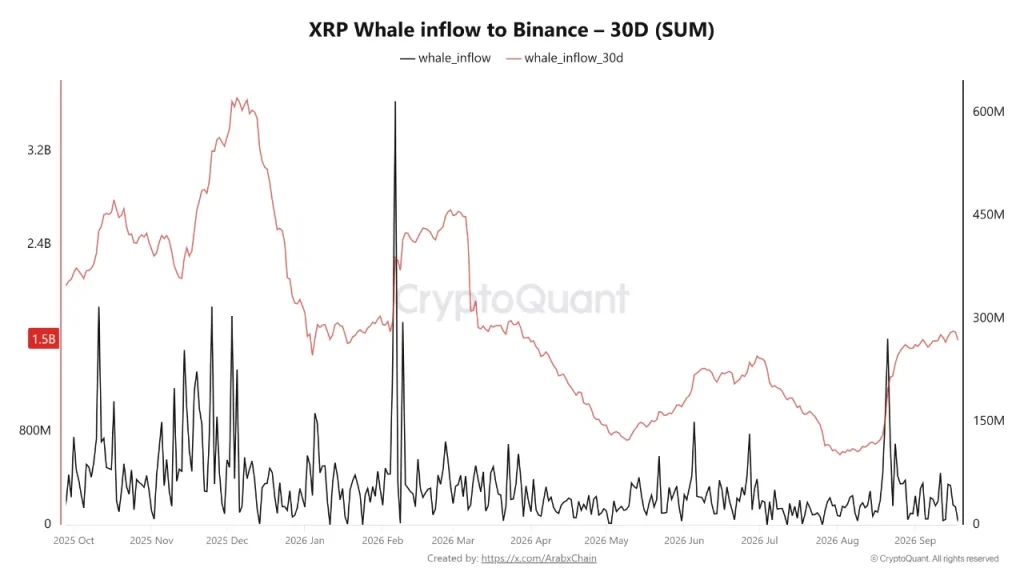
According to CryptoQuant data, the 30-day cumulative XRP inflow to Binance has climbed to roughly 1.6 billion XRP, marking its highest level since March 2026.
The trend had been moving in the opposite direction for several months.
XRP inflows declined steadily from March through July, followed by an additional drop of roughly 800 million XRP in August. The metric has since rebounded sharply, reaching approximately 1.6 billion XRP in September.
That’s a significant increase in XRP activity on the exchange.
But there’s an important distinction: higher whale inflows don’t automatically mean whales are selling.
Large holders can transfer XRP to Binance for several reasons, including trading, improving liquidity, portfolio management, or preparing for a potential sale.
So the current data shows increased whale activity, not definitive evidence that whales are dumping XRP.
What Happens Next for XRP?
XRP’s current setup comes down to a few critical levels.
$1.55 is the level bulls need to reclaim. A breakout above the inverse head-and-shoulders neckline could strengthen the bullish setup and put the $2 area in focus.
On the other hand, $1.20 remains an important support level. Losing that area could weaken the pattern and raise questions about the current reversal setup.
The potential golden cross provides another bullish signal, while rising Binance whale inflows add an additional metric for traders to monitor.
For now, XRP is sitting at an interesting technical crossroads. The next decisive move around these key levels could provide a clearer indication of whether the current bullish setup develops into a larger rally.