History Says XRP’s 70% Drop Is a Buying Opportunity: A Data-Driven Analysis
Let’s cut the hopium and dive straight into the numbers. XRP has a history that reads like a financial horror story, with 90% drawdowns that would make even seasoned traders queasy. But here’s what most analysts forget to mention: the recoveries were even more violent than the crashes.
We’re in the middle of another brutal correction right now, down 70% from the peak. The metrics are screaming that this time is different—but not necessarily in the way the “supercycle” fanboys claim. Let’s look at the actual performance data, not just the drawdowns.
The Historical Autopsy: The Crash AND The Comeback
XRP’s price action is defined by massive, volatile bubbles followed by devastating crashes—and then explosive recoveries that make the pain worth it for those who held.
The 2014-2017 Cycle: The Mother of All Comebacks
This cycle started with a devastating 96% crash from $0.06 to a low near $0.009. The drawdown took roughly 210 days—relatively quick compared to later cycles.
But here’s what the data shows about the recovery:
- Bottom price: ~$0.009
- Time to break previous high: Over 1,200 days (more than three years)
- Peak price in 2017: ~$3.00+
- Return from bottom to peak: +6,000%
This was the cycle that minted millionaires but tested the patience of saints. Buying at the bottom and holding through the accumulation phase yielded astronomical returns. But buying at the top meant being underwater for over three years. The 2014 cycle proved that XRP could destroy capital for years if you bought the wrong entry.
The 2017-2021 Cycle: The SEC Shock
After peaking above $3.00 in early 2018, XRP suffered a >90% decline, settling near $0.30 for most of the prolonged bear market.
The recovery performance:
- Bottom price: ~$0.30 (prolonged bear market)
- Time to bottom: ~400-790 days
- Peak price in 2021: ~$1.96
- Return from bottom to peak: +1,100% (from prolonged $0.30 range to $1.96)
- Secondary SEC-induced crash: 73% from $0.75 to $0.17 in weeks
- Recovery from SEC crash: +1,050% from $0.17 to $1.96
This cycle was unique. The SEC lawsuit in December 2020 triggered an XRP-specific crash of 73% to $0.17 in weeks. But the recovery was swift—XRP surged to $1.96 in April 2021. Those who bought the SEC-driven panic bottom saw over 10x returns in just four months.
The 2021-2025 Cycle: The Lawsuit Hangover
From the April 2021 peak of $1.96, XRP crashed -88% to a low around $0.22 in 2022. It then traded in a range near $0.30-$0.35 for most of 2022, 2023, and 2024.
The recovery performance:
- Bottom price: ~$0.22-$0.30
- Time to bottom: ~400-790 days
- Peak price in 2025: ~$3.65
- Return from bottom to peak: +180% (from $0.22 to $3.65)
- Return from the $0.30 range: +1,100% (from $0.30 to $3.65)
Patient accumulators who bought in the $0.30 range and held until the July 2025 peak saw returns approaching 10x. The SEC lawsuit overhang suppressed institutional demand for years, creating a massive accumulation opportunity.
The Recovery Pattern: Diminishing Returns, But Still Massive
The data shows a clear pattern of diminishing percentage returns with each cycle:
| Cycle | Bottom Price | Peak Price | Return |
|---|---|---|---|
| 2014-2017 | $0.009 | $3.00+ | +6,000% |
| 2017-2021 | $0.17-$0.30 | $1.96 | +1,100% |
| 2021-2025 | $0.22-$0.30 | $3.65 | +1,100% |
The astronomical +6,000% recoveries from a penny base are unlikely to repeat from today’s higher price levels. Instead, analysts expect more realistic recoveries in the +300% to +600% range from a bottom around $1.00, which would suggest a next macro peak in the $4 to $7+ range.
The Current Cycle: Where Are We Now?
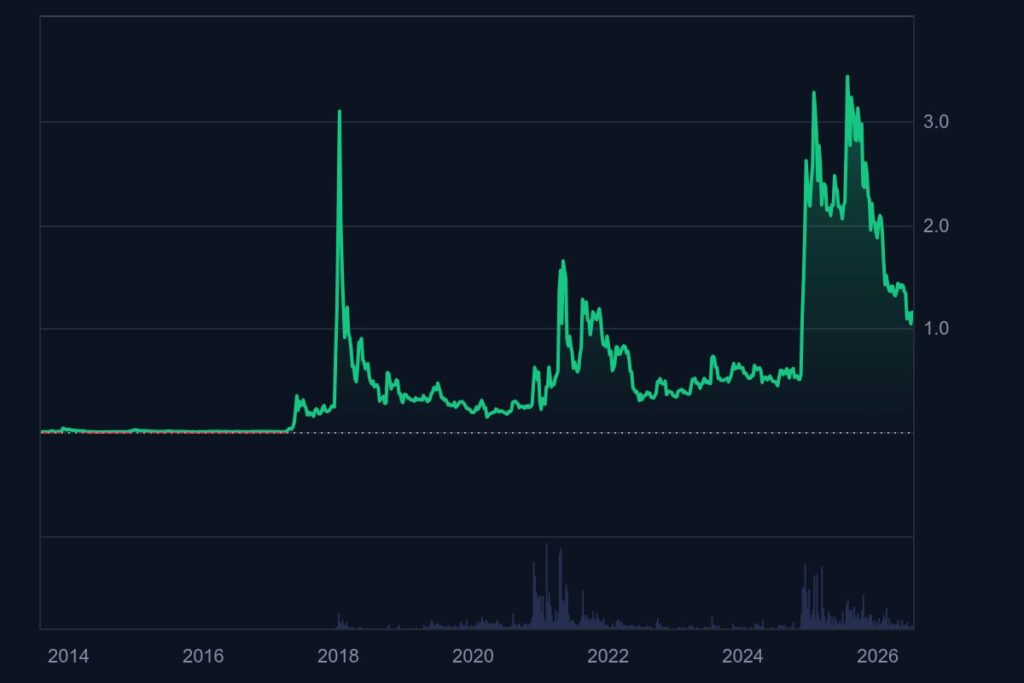
As of July 2026, XRP sits at roughly $1.09-$1.15, down about 70% from its July 2025 peak of $3.65. The current correction has run for approximately 350 days, which is shorter than the 400-790 days typical of previous bear markets.
Key observations:
- Shallower drawdown: 70% is painful, but it’s a far cry from the 85-96% plunges of previous cycles.
- Shorter duration (so far): 350 days vs. the 400-790 days historically required to bottom.
- Institutional inflows: XRP ETFs saw net inflows of roughly $1.42 billion in 2026—even as Bitcoin ETFs bled $1.7 billion.
The Likely Bottom Zone
Analysts are converging on $0.60 to $0.92 as the credible bottom zone for this cycle. Key technical levels to watch:
- The 2-week Gaussian Channel lower band: Has caught the bottom of every XRP bear market since 2017. Currently sits between $0.70 and $0.90.
- The $0.79-$0.91 Fibonacci support: Historical midterm-year trends suggest this is where XRP could bottom.
- Massive volume support: Over 1.16 billion XRP were transacted at $0.62, making that a strong historical support zone.
The Potential Recovery Performance
If the historical pattern holds and a bottom forms in the $0.70-$0.90 range, what could the recovery look like?
| Scenario | Bottom Price | Target Price | Return | Timeframe |
|---|---|---|---|---|
| Conservative | $0.90 | $3.65 (break even) | +300% | 12-18 months |
| Moderate | $0.80 | $5.00 | +525% | 18-24 months |
| Aggressive | $0.70 | $7.00-$8.00 | +900%-1,040% | 24-36 months |
| Bullish Supercycle | $0.70 | $13-$27 | +1,750%-3,750% | 2028-2030 |
Analyst projections based on Fibonacci extensions point to targets of $8, $13, and even $27. But these are aggressive scenarios that require a perfect alignment of institutional adoption, regulatory clarity, and market liquidity.
The Data is Divided: Signals vs. Structural Reality
This is where the analysis gets tricky. On one hand, the data points to a potentially historic buying opportunity. On the other hand, there is a massive structural overhang that the on-chain metrics don’t account for.
The Bullish Case (Data Backed)
- The “Bottoms” Are Getting Higher: If the pattern holds, the current consolidation around the $1.00 zone could represent a higher low. CryptoQuant data highlights that massive spikes in XRP transaction counts have historically preceded major price expansions. A similar surge in network activity was witnessed in April 2026, suggesting accumulation is quietly happening.
- Institutional Inflows: XRP has now been classified as a commodity by the SEC and CFTC. Spot XRP ETFs have accumulated over $1 billion in net inflows in 2026 alone—even as Bitcoin ETFs bled $1.7 billion. Financial institutions like Mastercard and Deutsche Bank have deepened their use of the XRP ecosystem. This structural shift doesn’t guarantee a higher bottom, but it does make a sustained stay at sub-$1 levels “less likely than in prior cycles.”
- The “Supercycle” Narrative: A verified high-IQ holder, YoungHoon Kim, has publicly stated the “XRP Supercycle is just beginning,” with price targets of $5–$10. Technical alignment like the Tom DeMark “9” buy signal and a Morning Star Doji pattern have recently formed, adding technical weight to the narrative.
The Bearish Structural Reality
- The Escrow Overhang: Ripple releases 1 billion XRP from its escrow every month (roughly $1.1 billion worth at current prices). This creates a constant supply overhang that the market must absorb. As of mid-2026, 32.74 billion XRP remain locked in escrow. The dip-buy thesis requires demand to exceed this constant supply of new tokens from Ripple. There is no data showing that the supply-demand imbalance is resolved.
- MVRV Doesn’t Fix Supply: The MVRV ratio tells us that recent buyers are underwater. But as one analyst noted, “MVRV is low because price is low… Price is low because the escrow overhang has outpaced demand.” The 30-day and 365-day MVRV ratios have hit a combined all-time low, meaning holders are experiencing more pain than at any point in XRP’s 12-year history. While this often signals a macro bottom, it doesn’t guarantee one.
The Verdict and Outlook
The Short Term (2026)
The data suggests a historical bottom could be forming. Analysts expect a potential bottom to form before the end of 2026, followed by an accumulation phase. The 2-week Gaussian Channel lower band has caught the bottom of every XRP bear market since 2017 and currently sits between $0.70 and $0.90. If XRP breaks below the critical support at $1.00–$1.05, the downside risk is significant, and the pain could continue. The neutral position is to watch this zone as the line in the sand.
The Long Term (2028-2030)
If a cycle bottom forms in 2026, historical cycle data suggests the next major top could occur between 2028 and 2030. Analyst projections based on Fibonacci extensions point to massive targets of $8, $13, and even $27. However, the path from here to there is not guaranteed. XRP must overcome the structural supply pressure from Ripple’s escrow. The 2014 cycle showed that it can take years to break previous highs.
The Bottom Line
The data does not support a “quick” recovery. The historical timeline for a bottom is the end of 2026, with a rally not truly materializing until the 2028-2030 macro window. The MVRV lows suggest extreme pain, which is a necessary ingredient for a bottom, but the Ripple escrow machine remains a multi-billion dollar headwind that cannot be ignored.
The recovery math:
- If you bought the 2022 bottom at $0.29 and held to $3.65, you got a 10x return.
- If you buy the 2026 bottom around $0.70-$0.90 and hold to the next peak, history suggests you might get a 3x to 6x return over the next 18-24 months.
- The juice is still there, just not as concentrated as the penny days.
- And this time, you won’t be fighting the SEC.
The cycle metrics are currently painting a picture of a suppressed asset waiting for a catalyst to break its shackles. That catalyst has not yet fully materialized in the data—but the foundation is being laid. If institutional adoption outpaces Ripple’s escrow distribution, the next bull run could catch many off guard. If it doesn’t, XRP may remain range-bound for years.
Either way, the data shows one thing with absolute clarity: the bottom has never been the time to panic. It’s historically been the time to accumulate.