SUI Set to Skyrocket? Here’s Why a 200% Surge and $11 Price Target Are Within Reach

Why SUI Could Be Poised for a Major Bullish Breakout
If you’ve been tracking SUI, you know it’s been in correction mode for weeks. But here’s the exciting part: the charts are now flashing strong signals that a major bullish reversal could be right around the corner.
What Just Happened with SUI?
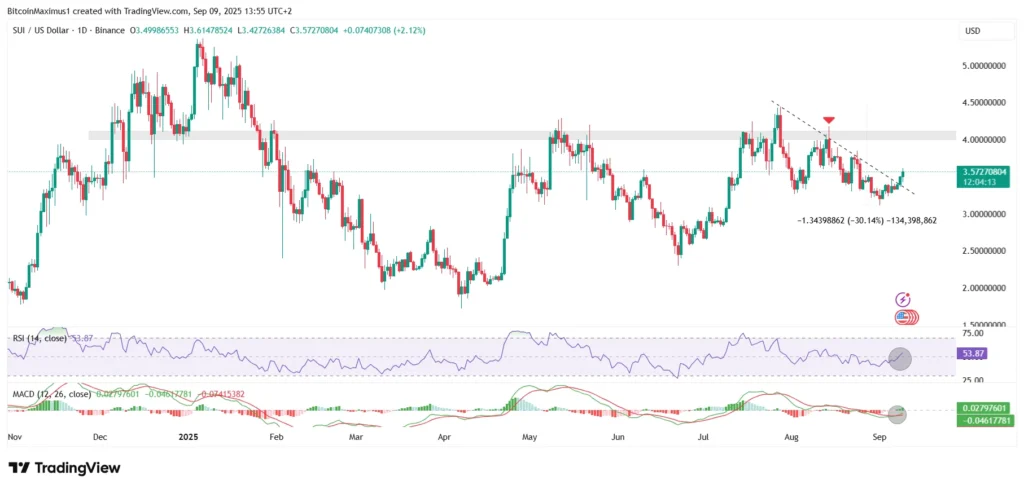
After struggling to hold above the critical $4.05 level, SUI’s price finally broke free from a long-standing descending resistance trend line. This week, it’s testing that key $4.05 horizontal resistance again — a level that has proven tough to crack for months.
Now, the momentum is building fast. Once SUI breaks through $4.05, we could see it surge toward fresh all-time highs. And we’re not just talking hope here — the technical indicators back it up.
Here’s The Data You Need to Know
Since July, SUI’s price took a nosedive after briefly breaking above $4.05. By early September, it had dropped nearly 30%, bottoming out at $3.11. But fast-forward to now, and SUI has started a powerful rebound, even breaking out from a key diagonal resistance.
What makes $4.05 such a critical level? Simple — it’s been a major horizontal resistance for months. Break above this level, and SUI clears its final barrier before a potential big run.
On the momentum side, both the Relative Strength Index (RSI) and the MACD are aligning bullishly. RSI recently crossed above 50, and MACD made a bullish crossover. These aren’t coincidences — they suggest real upward momentum is brewing.
What’s Next for SUI?
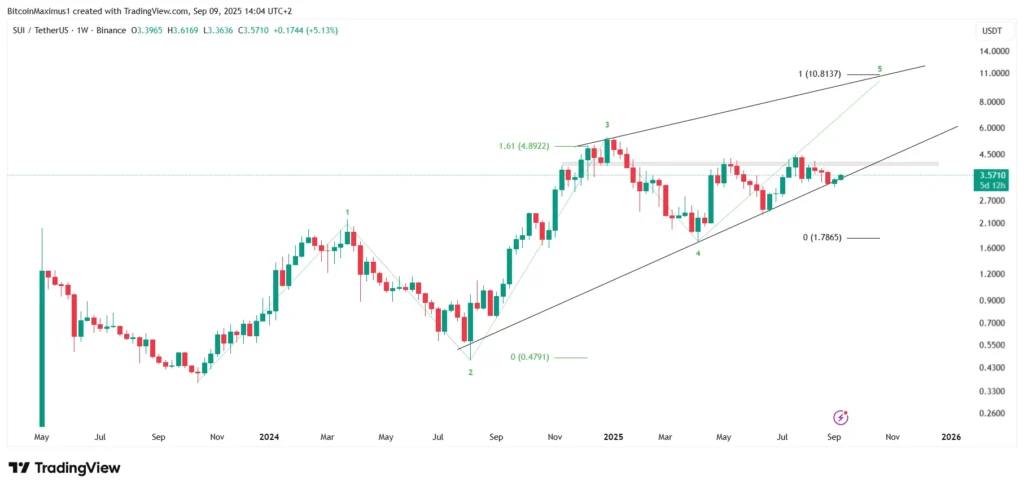
Zooming out to the weekly timeframe, SUI appears to be in the final wave of an upward movement that started in October 2023. The price action is forming what looks like a leading diagonal — basically an ascending wedge pattern. This supports the idea that the recent correction is already over and the uptrend is resuming.
An interesting detail: wave three is 1.61x the size of wave one — classic technical behavior. This pattern suggests a target of around $10.83, right where the diagonal resistance meets the projection of the wave structure.
Right now, SUI has completed a 1-2/1-2 wave structure, which means the next move should be the most aggressive — wave three in full throttle.
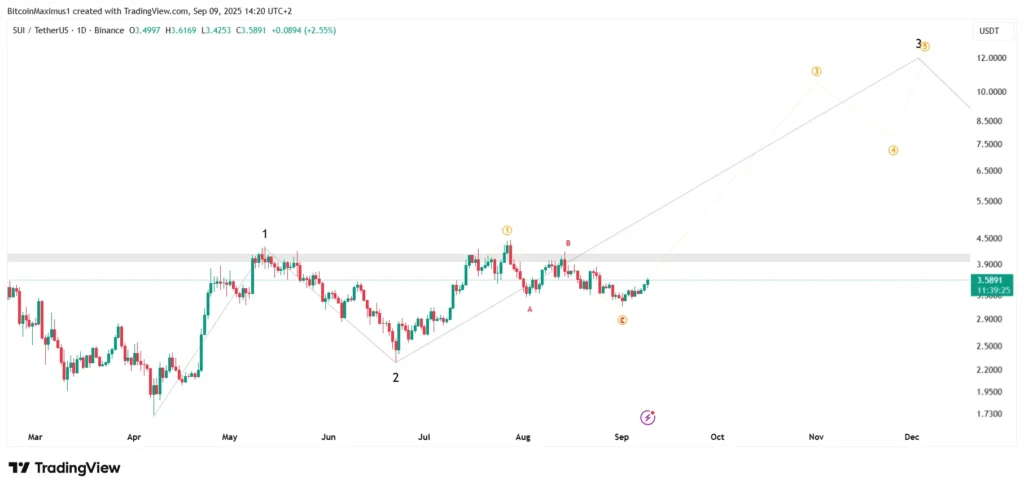
And don’t get fooled — what looked like a possible A-B-C top reversal structure turned out to be an A-B-C correction instead. That’s good news for bulls.
The Bottom Line
$4.05 is the key battleground. Once SUI clears it, the next stop could very well be new all-time highs. With technical momentum indicators pointing bullish and a textbook wave structure unfolding, this could be the moment traders have been waiting for.
If you’re watching SUI, keep your eyes glued to that $4.05 level. A breakout here won’t just be another price movement — it could be the gateway to explosive gains.