Shiba Inu Just Flashed a Breakout Signal — Can This Breakout Send Prices Soaring 143%?
Shiba Inu (SHIB) isn’t just wagging its tail — it’s gearing up to pounce.
After bouncing back 1.47% from a recent low, this meme coin darling is suddenly back in the spotlight. And if you’re watching SHIB closely (like smart investors are), the next move could be big.
Let’s break it down.
📊 From Bounce to Breakout: Why Shiba Inu Might Be Gearing Up for a Major Move
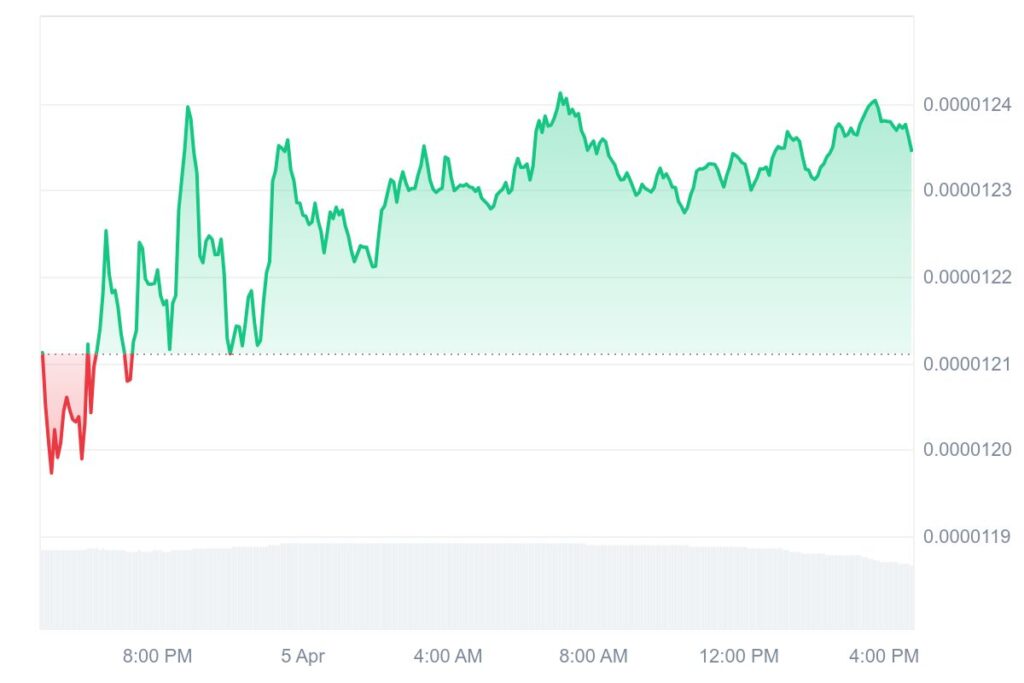
It started with a quiet rebound. After dipping to $0.00001182, SHIB clawed its way back up — and now sits firmly in bullish territory.
But this isn’t just another bounce. Behind the scenes, technical indicators are lining up like dominoes, and they all point to the same thing:
Shiba Inu could be prepping for a run to its December highs — and possibly beyond, toward $0.00003036.
🔍 RSI, MACD & WTO Are All Flashing Green
Let’s talk indicators — because the data is making traders pay attention:
- RSI is currently at 34.17
➤ That’s dangerously close to oversold territory — the sweet spot where smart money starts buying. - MACD lines are converging upward
➤ That’s a classic sign of trend reversal, and it’s exactly what bulls want to see. - WTO (Wave Trend Oscillator) is moving into bullish territory
➤ Translation: Buying pressure is building, and momentum is shifting.
When these three indicators light up at once, it’s like watching the market whisper, “The bulls are coming.”
📉 But Wait — What About That Bearish Ichimoku Cloud?
Great question. Yes, the Ichimoku Cloud still casts a shadow over SHIB’s chart. But here’s what the pros are seeing:
- The cloud is compressing — a signal that downward pressure is losing steam.
- Accumulation zones are forming underneath — hinting that long-term holders are quietly stacking up.
And remember: In technical analysis, compression often precedes expansion. That means when SHIB breaks out of this cloud, the move could be explosive.
💡 What’s Really Going On Behind the Scenes?
Here’s the part many retail traders miss: A lesser-known pattern called a descending wedge is forming on the 3-day chart.
- This is a bullish formation — and when price gets to the wedge’s tip (which is where SHIB is now), breakouts tend to follow.
Top TradingView analyst “Bicoinmoney” calls this one out clearly:
“This isn’t just a fakeout. We could be seeing the start of a much longer climb.”
📈 SHIB to $0.00003036? Here’s the Bull Case
If SHIB breaks above the current resistance ($0.00001200) and confirms the wedge pattern, it could:
- Flip resistance into support
- Reignite buyer momentum
- Start a potential rally toward $0.00003036, mirroring December levels — a +143% move from current prices.
Of course, if sellers step in and profit-taking kicks up, we could revisit the $0.00001000–$0.00001100 zone. But the trend? It’s looking bullish.
🧠 Final Thoughts: Is Now the Time to Watch SHIB?
Shiba Inu is showing all the signs of a potential turnaround. The meme coin that once ran on hype is now backed by serious technical strength — and traders are taking notice.
If you’re holding SHIB or thinking about jumping in, this might be the perfect time to zoom out, watch the charts, and position accordingly.
Because if the breakout happens — and the indicators say it just might — SHIB could lead one of the most surprising rallies of the quarter.