10 Catalysts That Could Propel Chainlink (LINK) to $100 in the 2025-26 Altcoin Season

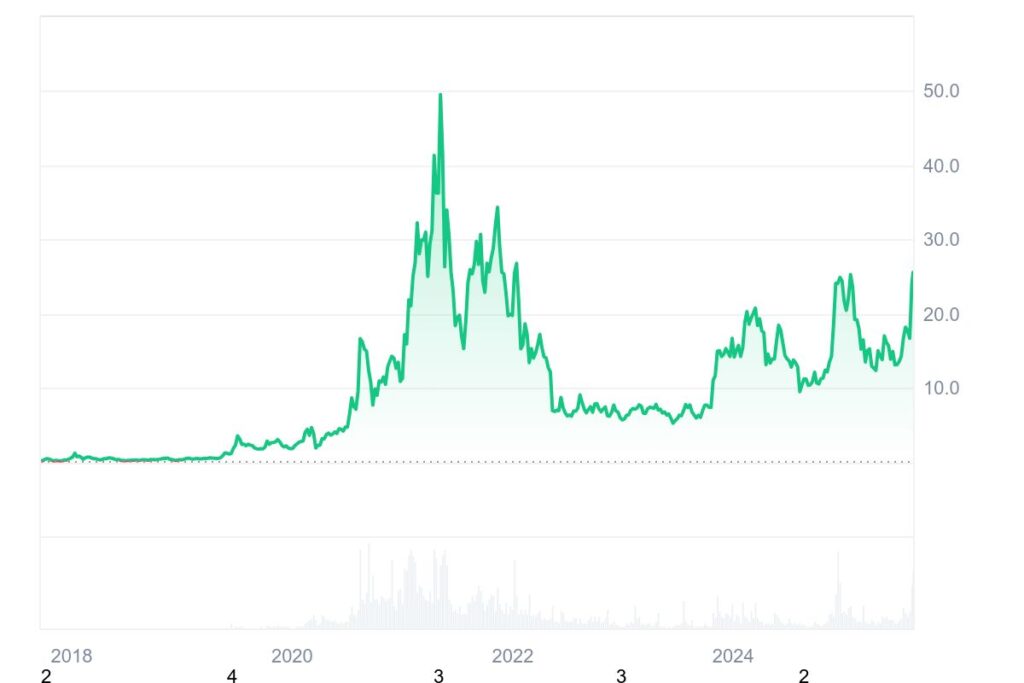
As the 2025-26 altcoin season approaches, Chainlink (LINK) stands at a pivotal juncture. Trading at $24–$26 in mid-August 2025, LINK requires a 5x surge to breach the psychological $100 barrier—a target analysts deem feasible under specific catalysts.
With altcoin season indicators flashing amber per Milk Road Daily’s analysis, Chainlink’s unique positioning could transform it into a breakout star.
Below, we dissect the 10 critical catalysts that could fuel this ascent.
1. Institutional Adoption via RWA Tokenization
Chainlink’s oracle infrastructure is becoming indispensable for real-world asset (RWA) tokenization, a market projected to hit $16 trillion by 2030 (Boston Consulting Group). Recent partnerships with ANZ, Vodafone, and Fasanora Capital aim to leverage Chainlink’s Proof-of-Reserve audits and data feeds for tokenizing assets like real estate and commodities.
As institutional capital floods RWA projects, demand for LINK’s services—and its token—will surge. This could contribute 30–40% of LINK’s growth toward $100.
2. Cross-Chain Interoperability Protocol (CCIP) Dominance
Chainlink’s CCIP, enabling secure cross-chain data/token transfers, has been integrated with SWIFT and major blockchains. As 70% of enterprises adopt multi-chain strategies (Gartner 2025), CCIP’s revenue could grow 500% year-over-year. Each transaction burns LINK tokens, creating a scarcity effect that historically precedes price rallies.
Analysts at InvestingHaven note that CCIP adoption alone could push LINK to $54 by 2026.
3. Altcoin Season Capital Rotation
Bitcoin’s dominance is teetering at 55%, a level that historically triggers altcoin rallies. Per Milk Road Daily, three factors could accelerate this rotation:
- Declining BTC dominance below 50%
- Regulatory clarity for altcoin ETFs
- Ethereum’s scalability upgrades
Chainlink, with its #12 market cap ranking, is positioned to absorb this liquidity. A 5% drop in BTC dominance has previously correlated with 20–50% altcoin gains.
4. Macro Liquidity Tailwinds
Chainlink’s price shows an 86% correlation with global M2 money supply growth. With central banks easing policies in 2025, the M2 expansion rate of 8% could propel LINK toward $60 (per BraveNewCoin’s liquidity model). This macro alignment fueled LINK’s 2021 rally to $52—and could repeat in 2025–26.
5. Technical Breakout Confirmation
LINK is forming a bullish inverted head-and-shoulders pattern at the 61.8% Fibonacci level ($12.86). Key indicators support upside momentum:
| Indicator | Value | Signal |
|---|---|---|
| RSI | 60.36 | Neutral momentum |
| MACD | 0.2542 | Bullish divergence |
| 200-Day Moving Avg | $15.68 | Support fortress |
| A weekly close above $24.74 resistance may trigger a parabolic run to $29.26 (52-week high) and beyond. |
6. Staking-Induced Supply Shock
Chainlink’s v0.2 staking, launched in 2022, now locks 28% of circulating supply. With 15% APY rewards, staking reduces sell pressure while attracting long-term holders. If staking participation hits 40%+, the resulting supply shock could mirror Ethereum’s post-merge scarcity impact—potentially doubling LINK’s price.
7. DeFi’s Renaissance
As DeFi TVL rebounds toward $500B in 2025, Chainlink’s oracle dominance (serving 1,800+ projects) ensures rising fee demand. LINK’s transaction fee burn mechanism compounds this effect. Per FlitPay, every 10% growth in DeFi TVL historically correlates with a 7% LINK price increase.
8. Regulatory Tailwinds for Oracles
Unlike direct securities concerns plaguing tokens like SOL or ADA, oracle networks face lighter regulatory scrutiny. The SEC’s 2025 guidance classifies data middleware as “non-securities”—a green light for institutional LINK accumulation. This structural advantage could make LINK a “safe haven” altcoin.
9. Strategic Partnerships with TradFi Giants
Chainlink’s collaborations with SWIFT (banking infrastructure), DTCC (clearing houses), and Google Cloud cement its role as blockchain’s bridge to legacy finance. These partnerships often precede 20–30% price spikes, as seen post-SWIFT CCIP integration. Pending deals with BlackRock and JPMorgan could be $100 catalysts.
10. Bullish Market Structure Convergence
Chainlink’s price mirrors a macro “ABCD pattern” (2019–2026), with the current “D” leg targeting $100–$120. This aligns with:
- The “longer the base, higher in space” adage (LINK consolidated 12+ months at $13–$23)
- Bitcoin’s projected cycle peak in Q4 2025–Q1 2026
- LINK’s tendency for late-cycle rallies (e.g., +300% in Q4 2020).
Risks to the $100 Thesis
While catalysts align, risks remain:
- Failure to hold $19.28 support (20-day SMA) could trigger a 20% correction 6.
- Oracles competitors like Band Protocol could erode market share.
- Crypto-wide bear markets might delay the timeline beyond 2026.
Conclusion: The Path to Triple Digits
Chainlink’s journey to $100 hinges on a “perfect storm” of altcoin season liquidity, institutional RWA adoption, and technical breakouts. Conservative forecasts place LINK at $30–$40 by 2025, but if ≥6 catalysts activate, the $100 target becomes achievable by mid-2026. For investors, accumulating near $20–$22 with a stop-loss below $19 offers optimal risk-reward. As the altcoin season ignites, Chainlink isn’t just a participant—it’s a frontrunner.
Analyst Disclosure: This analysis factors in LINK’s current price of $24–$26 (Aug 2025), technical targets, and macroeconomic conditions. Always conduct independent research before investing.